Posts

Scraping entire text & keywords from the webpage with help of newspaper & nltk || Python
Image
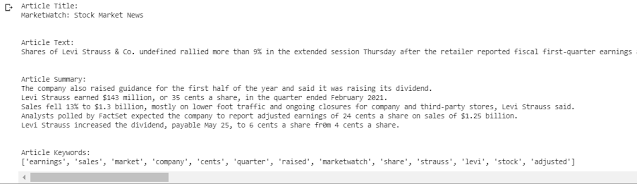
 I'm using the newspaper and nltk library for scraping, summarizing & converting articles from a webpage to a text file.  Here the tokenizer "punkt" is used for  splitting a phrase, sentence, paragraph,  into smaller units, such as individual words or terms. #importing libraries from  newspaper  import  Article import  nltk #create tokenizer nltk.download( 'punkt' ) #input-website and create object for article url=  'https://www.marketwatch.com/' article = Article(url, language= "en" ) #downloading/parsing/npl the article article.download() article.parse() article.nlp() #printing the scraped>processed data print ( "Article Title:" )  print (article.title)  #prints the title of the article print ( "\n" )  print ( "Article Text:" )  print (article.text)  #prints the entire text of...

Force Index On Python

Image
  The  force index  ( FI ) is an indicator used in technical analysis  to illustrate how strong the actual buying or selling pressure is. High positive values mean there is a strong rising trend, and low values signify a strong downward trend. The FI is calculated by multiplying the difference between the last and previous closing prices by the volume of the commodity, yielding a momentum scaled by the volume. The strength of the force is determined by a larger price change or by a larger volume. The Formula for the Force Index Is: \begin{aligned} &\text{FI}\left(1\right)=\left(\text{CCP }-\text{ PCP}\right)*\text{VFI}\left(13\right)=\\ &\text{13-Period EMA of FI}\left(1\right)\\ &\textbf{where:}\\ &\text{FI = Force index}\\ &\text{CCP = Current close price}\\ &\text{PCP = Prior close price}\\ &\text{VFI = Volume force index}\\ &\text{EMA = Exponential moving average}\\ \end{aligned} ​ FI ( 1 ) = ( CCP  −  PCP ) ∗ VFI ( 1 3...

News Article Scraping || Python || BeautifulSoup

I was learning about Sentiment Analysis and for that purpose, I was in need of news article in CSV format, so now to get those news articles in CSV format I came up with the solution of  Web scraping those articles with the help of a python library called " BeautifulSoup " which is a  Python package for parsing HTML and XML documents. It creates a parse tree for parsed pages that can be used to extract data from HTML, which is useful for web scraping. Now, how & what I did is shown here below in the code. #Importing libraries import  urllib.request,sys,time from  bs4  import  BeautifulSoup import  requests import  pandas  as  pd pagesToGet=  1 upperframe=[]   for  page  in   range ( 1 ,pagesToGet+ 1 ):      print ( 'processing page :' , page)     url =  'https://www.marketwatch.com/markets?mod=top_nav/?page=' +str(page)   ...

Commodity Channel Index ( CCI ) Using Python

Image
The CCI compares the  current price  to an  average price  over a period of time. The indicator fluctuates above or below zero, moving into positive or negative territory. While most values, approximately 75%, fall between -100 and +100, about 25% of the values fall outside this range, indicating a lot of weakness or strength in the price movement. CCI is calculated with the following formula: (Typical Price - Simple Moving Average) / (0.015 x Mean Deviation) When the CCI is above +100, this means the price is well above the average price as measured by the indicator. When the indicator is below -100, the price is well below the average price. A basic CCI strategy is used to track the CCI for movement above +100, which generates  buy signals , and movements below -100, which generates  sell  or  short  trade signals. Investors may only want to take the buy signals, exit when the sell signals occur, and then re-invest when the buy signal...

Moving Averages On Python || SMA & EWMA

Image
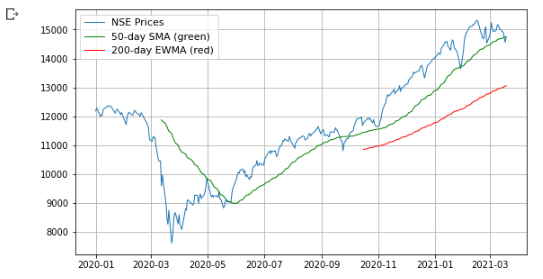
Moving average is a simple, technical analysis tool. Moving averages are usually calculated to identify the trend direction of a stock or to determine its support and resistance levels. It is a trend-following — or  lagging — indicator because it is based on past prices. There are various types of moving averages, like SMA & EMA so I tried to create a moving average indicator in which I have plotted 2 moving averages with the help of historical data. A simple moving average (SMA) is a calculation that takes the arithmetic mean of a given set of prices over the specific number of days in the past; for example, over the previous 15, 30, 100, or 200 days. Exponential moving averages (EMA) is a weighted average that gives greater importance to the price of a stock on more recent days, making it an indicator that is more responsive to new information.   # Load the necessary packages and modules from  pandas_datareader  import  data...

Net Present Value (NPV) On Python Using Numpy

Image
Net present value (NPV) is the difference between the present value of cash inflows and the present  value  of cash outflows over a period of time.   NPV is used in  capital budgeting  and investment planning. The NPV Rule is:- If  NPV > 0  Then the project is Accepted  If  NPV < 0 Then the project is Rejected The formula for calculating NPV is - = net present value = net cash flow at time t = discount rate = time of the cash flow This is how NPV is calculated manually with the generic formula, now we are going to use NumPy for calculating the NPV of a project. Here is an example. The initial investment is $100. The cash inflows in the next five years are $50, $60, $70, $100, and $20, starting from year one. If the discount rate is 11.2%, what is the project's NPV value?  #import Numpy  import  numpy  as  np #Put/define values in the cashflows & Interestrate. CF0 =...

Portfolio Optimization In Python

Image
  A portfolio is a collection of financial investments like stocks, bonds, commodities, cash, and cash equivalents, including  closed-end funds  and  exchange-traded funds  (ETFs), here in this topic I'm talking about stock portfolios. Portfolio optimization is the process of selecting the best portfolio, out of the set of all portfolios being considered, according to some objective. The objective typically maximizes factors such as expected return and minimizes financial risk. With the help of "daily returns", "annualized covariance matrix","portfolio variance","portfolio volatility" and "annual portfolio return" I'll do portfolio optimization on python. I'll take historical data of stocks with the help of "pandas DataReader" and then use statics formulas mentioned above to do the optimization and state what is the annual return and risk involved in the particular portfolio I've selected  I'm using Google ...