Moving Averages On Python || SMA & EWMA
Moving average is a simple, technical analysis tool. Moving averages are usually calculated to identify the trend direction of a stock or to determine its support and resistance levels. It is a trend-following—or lagging—indicator because it is based on past prices.
There are various types of moving averages, like SMA & EMA so I tried to create a moving average indicator in which I have plotted 2 moving averages with the help of historical data.
A simple moving average (SMA) is a calculation that takes the arithmetic mean of a given set of prices over the specific number of days in the past; for example, over the previous 15, 30, 100, or 200 days.
Exponential moving averages (EMA) is a weighted average that gives greater importance to the price of a stock on more recent days, making it an indicator that is more responsive to new information.
Here is the output of my program, moving average of 50-days SMA and 200 days EWMA from
1st January 2020 to March 2021.
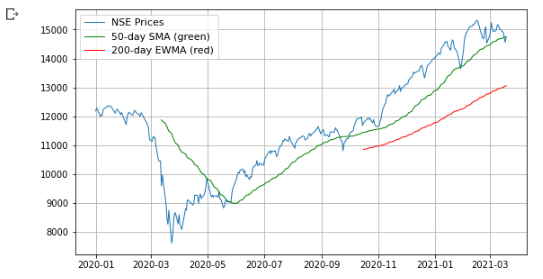
And here is the screenshot of the moving average from my trading portal.

The program which I compiled is giving the exact result as my trading portal is giving
which means my calculations in the program are executed correctly


Comments
Post a Comment