Posts

Showing posts with the label EMA

Force Index On Python

Image
  The  force index  ( FI ) is an indicator used in technical analysis  to illustrate how strong the actual buying or selling pressure is. High positive values mean there is a strong rising trend, and low values signify a strong downward trend. The FI is calculated by multiplying the difference between the last and previous closing prices by the volume of the commodity, yielding a momentum scaled by the volume. The strength of the force is determined by a larger price change or by a larger volume. The Formula for the Force Index Is: \begin{aligned} &\text{FI}\left(1\right)=\left(\text{CCP }-\text{ PCP}\right)*\text{VFI}\left(13\right)=\\ &\text{13-Period EMA of FI}\left(1\right)\\ &\textbf{where:}\\ &\text{FI = Force index}\\ &\text{CCP = Current close price}\\ &\text{PCP = Prior close price}\\ &\text{VFI = Volume force index}\\ &\text{EMA = Exponential moving average}\\ \end{aligned} ​ FI ( 1 ) = ( CCP  −  PCP ) ∗ VFI ( 1 3...
Moving Averages On Python || SMA & EWMA

Image
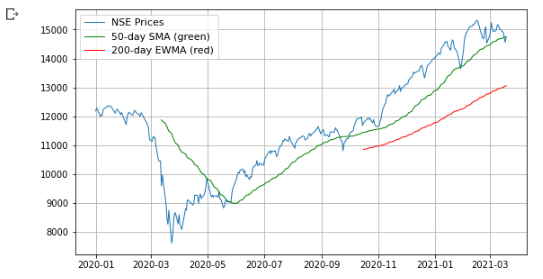
Moving average is a simple, technical analysis tool. Moving averages are usually calculated to identify the trend direction of a stock or to determine its support and resistance levels. It is a trend-following — or  lagging — indicator because it is based on past prices. There are various types of moving averages, like SMA & EMA so I tried to create a moving average indicator in which I have plotted 2 moving averages with the help of historical data. A simple moving average (SMA) is a calculation that takes the arithmetic mean of a given set of prices over the specific number of days in the past; for example, over the previous 15, 30, 100, or 200 days. Exponential moving averages (EMA) is a weighted average that gives greater importance to the price of a stock on more recent days, making it an indicator that is more responsive to new information.   # Load the necessary packages and modules from  pandas_datareader  import  data...