Sectoral Analysis || FMCG Sector || Report
Sectoral Analysis || FMCG Sector || Report
Economic Overview
Sectorial Analysis
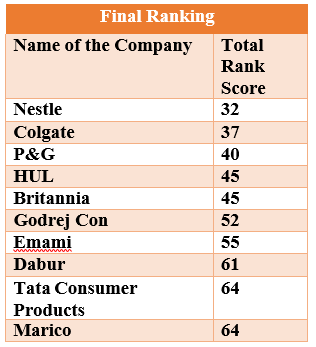
- Market share gain opportunities for category leaders
In turbulent times, cos with strong distribution, product diversification, on and superior execution, were expected to gain further market share. Bolt-on acquisitions are likely to gain pace as small players find it difficult to sustain themselves. Cos will focus on cost optimization, which along with lower input costs and A&P moderation will help mitigate the negative operating leverage.
- Topline Recovery
Macro support for the growth has been lacking, as most indicators (negative real rural wage growth, agricultural growth, MSP rates, job creation, and Consumer Confidence Index) were not reflecting a meaningful recovery.Covid-19-induced slowdown will hurt income growth at bottom of the pyramid, which will hurt non-essential staples consumption with a lag.
- Category wise analysis
In category-wise analysis, interestingly, even during the economic slowdown of the trailing 12 months, categories like F&B, QSR, Home Care, Cigarettes, Liquor, and OTC FMCG grew at 6- 8%. In contrast, laggards like Personal Care and Hair CaregreCare grew.

The above exhibit shows the revenue performance, YOY growth percentage, and average growth percentage. The expected growth for FY21 was 20% with YOY growth of 4.8%. Over the last few years, the revenue has been consistently increasing

The EBITDA has been increasing for the last few years indicating a positive trend. The expected EBITDA for the year 2020 was 23% and YOY growth was 10%.
Product Innovation
Hindustan Unilever (HUL)
- HUL launched 100 plus stock-keeping units (SKUs) focusing mainly on the hygiene category.
- Expansion of products like Domex to pan-India saw a strong response and the company was able to capitalize on the hygiene trend considering the pandemic.
- Lifebuoy sanitizer helped drive penetration for the brand.
Nestle
- Nestle has focused its launches on packaged foods, which saw a surge in demand during the lockdown
- Co is also entering fried rice seasoning in 2HFY21 and it has now extended Poha and Upma into the meals-in-a-bowl category to strengthen its presence in the travel segment.
ITC
- ITC saw strong growth during 2QFY21 within 75% of its FMCG portfolio comprising foods, healthcare, and hygiene (up 25% YoY)
- Growth was supported by 70+ new launches made by co during 1HFY21, primarily in the hygiene category.
- Co also made several new launches within its food portfolio to capitalize on the increased demand for packaged food during the lockdown. - Value-added variants ofAashirwaad atta helped to consolidate its market share in the segment.
Dabur
- Dabur focused its launches on the healthcare and hygiene category with a strong expansion in health supplements. Increased awareness around health led to a rise in demand for immunity-boosting accessories.
- Co also expanded its Foods portfolio as demand for in-home consumption returned to growth in 2QFY21.
Britannia
- Britannia focused on scaling its product offering in the market and the company made limited new launches during this period.
Colgate
- Colgate continued its innovation during 1HFY21 with the launch of Colgate VedshaktiMouthspray in a pocket-sized pack.
- Co continued expanding its toothpaste portfolio with Colgate Visible White Instant'slaunch in the teeth whitening toothpaste category.
- The company also launched a new Colgate Gentle range of toothbrushes along with a relaunch of Colgate ZigZag.
- Earlier in 1QFY21, Colgate entered hand sanitizers under the Palmolive brand.
Godrej Consumer Products
- GCPL sustained its focus on innovation and expanded its presence in the hygiene range at a high pace. It scaled the Protekt brand across all hygiene products in 1HFY21.
- In 1QFY21 itself, the company launched 45 new products in response to the surge in Lindemann demand for sanitizers, hand washes, soaps, and other hygiene products
- Brands such as Aer and Ezee were also expanded to include sanitizing variants.
Marico
- Marico strengthened its healthcare and hygiene portfolio during 1HFY21 with several innovative launches in the categories.
- The company entered two major segments with the launch of Saffola Honey and SaffolaArogyam Chyawan Amrut (Chyawanprash) which saw a strong response.
- Saffola Honey captured an 8% share in MT. It also launched Ayurvedic recipes in the Saffold ImmuniVeda range.
Emami
- Emami launched an entire range of Hygiene products under the BoroPlus brand.
- Co also scaled up Ayurveda offerings under Zandu to capitalize on the increased focus on health.
- Additionally, Emami also made some exclusive launches on e-comm to drive growth from the channel.
Distribution Reach

Increasing Online FMCG Sales

Future Plans and Strategies
- Strengthen the Rural Market
In February 2021, Nestle India announced plans to reach ~1.2 lakh villages (with each having population of over 5,000) over the next 2-3 years. Other players such as Maricois introducingg bottom-of-the-pyramid products to its portfolio of value-added hair oil, helping the business reach rural markets. Rural penetration will continue to be important for Godrej Consumer Goods Ltd. Over the next three years, the organization plans to extend its presence to 80,000 villages in key states.
- Direct to Customer Channels
Businesses such as Dabur India and Marico Ltd. have introduced retail telephone serviceservices and out a dedicated app that enables orders to be placed by kiranas. In January 2021, Tata Consumer Products announced that it is looking for ways to add more of its beverages’ portfolio onto a direct-to-consumer platform to capture the urban online market.
- New Market Entry
In January 2021, FMCG businesses in India are planning to expand their oral care portfolio by entering new and niche categories such as mouth sprays, ayurvedic mouth cleansers, and mouthwashes to meet the rising consumer demand for hygiene products DeDecember020, Godrej Consumer Products Limited (GCPL), under its Godrej ProClean brand, ventured into home cleaning products to meet the rising demand for cleaning and hygiene products among Indian consumers. The home cleaning products segment, which includes branded floor, toilet, and bathroom cleaners, is estimated to be ~ Rs. 2,600crores.
- Green Initiatives
FMCG companies are looking to invest in energy-efficient plants to benefit society and lower costs in the long term. Procter & Gamble (P&G) India has set up a Rs. 200 crorcrores$ 28 million) environmental sustainability fund in the country to offer sustainable solutions, such as plastic-free packaging and environment-friendly logisticsservices, in partnership with Indian businesses.
Data Analysis
Fundamental Analysis
Steps followed in Fundamental Analysis

- Overvalued companies are those, for which people have positive sentiments and the market participants are ready to invest in the share even at a high price, as they expect its future earnings to grow. The list of Overvalued companies is as below:

- Undervalued companies are those, that are performing well, but not according to the aspirations of the investors, thus they overlook these stocks. The list of Undervaluedcompanies is as below:

- Analysis of Overvalued Companies
The Overvalued companies will be analyzed on basis of the PEG ratio. Price-Earnings- Growth ratio (PEG) denotes the value while considering the future growth in the earning earnings ofmpany.
[PEG ratio = (P/E Ratio) / (EPS Growth rate)]
- PEG ratio is considered a more accurate measure of the value of the company as compared to the standard P/E ratio, as it takes into consideration the future growth in earnings of the company, while the P/E ratio gives the value of the company only for that particular period. PEG ratio can also be analyzed for historical data. For this report, historical data has been considered for analysis. In the table below it can see that the EPS of HDFC has fallen as compared to the previous year. Thus, for negative growth in EPS, the PEG ratio is 0 and is rejected.

Step 7: Based on the above figures, we have decided on the companies or stocks whichwill comprise our fund. However, further analysis was needed to determine how much amount will be invested in the company. This analysis is termed a Ratio Analysis.
Ratio Analysis
All the data related to the calculation of the ratios have been obtained from the Annual Reports of all the mentioned companies.
One of ththeethodsmpanyy valuation methodsalysis of Financial Ratios’. Each ratio depicts an aspect of the items in the financial statements of the company. Various ratios are in existence or can be created to satisfy a certain purpose. But, all the ratios are not required to be calculated for every company and sector. Every sector has a unique set of ratios that are used by analysts to get a clear picture of the sector or the company.
- Return on Capital Employed (ROCE)
Return on Capital Employed (ROCE) is a measure used to assess the profitability and capital efficiency of the company. So, this ratio helps us to understand howwell the company is generating profits from the capital employed in the business. So, the higher the ROCE, the better. [Return on Capital Employed = EBIT/Capital Employed] In the case of the FMCG sector, the business is capital intensive. However, the companies in thissector are wthisthisorished and have big plans to carry out their operations. Hence, the companies may incur less capital expenditure.

Return on Capital Employed (ROCE) is a measure used to assess the profitability and capital efficiency of the company. So, this ratio helps us to understand how well the company is generating profits from the capital employed in the business. So, the higher the ROCE, the better. [Return on Capital Employed = EBIT/Capital Employed] The business is capital intensive in the FMCG sector. However, the companies in this sector are well established and have big plans to carry out their operations. Hence, the companies may incur less capital expenditure.
- Return on Equity (ROE)
Return on Equity (ROE) is a measure of a company’s profitability about shareholder’s equity. Higher returns to Equity holders attract prospective investors. The s Itsshowse capaThis bility of the management to use the shareholder’s funds to create the maximum returns for them. It is calculated using the following formula:
[Return on Equity (ROE) = Net Income/Shareholders Equity]
It is a very useful ratio from the shareholder’s point of view to analyze and compare the returns while investing. It is obtained by dividing the net profits (after int. and taxes) by the shareholder’s funds.

A higher ratio shows better efficiency of the management. The efficiency of the management decides the future of the business. It is the management that takes all important decisions relating to capital structure, earnings, and assets of the business based on their risk perception. Nestle has the best ROE among its peers and Tata Consumer Products has the worst ROE.
Debt Equity Ratio

Debtors Turnover Ratio

Technical Analysis
Dabur Ltd.

Godrej Consumer Products

Standard Deviation

Recommendations
- Although the Covid-19 Pandemic has affected the FMCG sector the companies in this sector have fared well and overcome the barriers. More growth is expected in rural areas for essentials which will boost the sales of FMCG products.
- The FMCG sector has a combination of both Growth and Value Stocks, making this sector the best investment. The companies in this sector are almost debt-free which is very important from an investor’s point of view.
- However, these companies can borrow little debt to expand their business operations and take the advantage of leverage
- Companies like Hindustan Unilever are best for growth investing since the company is an FMCG giant with the largest market capitalization and strong fundamentals and established business with different product lines and segments.
- Marico and Dabur will be the leading players in the long run with their aggressive business style and operations and a valuable investment for the investors.
- These stocks can be used to create a portfolio for investors or can be used by Asset Management Company to create a Large Cap Mutual Fund.
- The rationale of this mutual fund of FMCG large-cap fund will be long-term capital appreciation. This fund can be further compared with the Nifty FMCG Benchmark Index to track its performance.
- Since it’s an equity-based fund, the risk would be very high. Hence, this fund is recommended for working professionals and long-term investors and not old-aged people


Comments
Post a Comment